Beyond DORA dashboards
Book Your Engineering Plan Session
A short working session. Map today’s pain to a 1‑page plan you can act on.
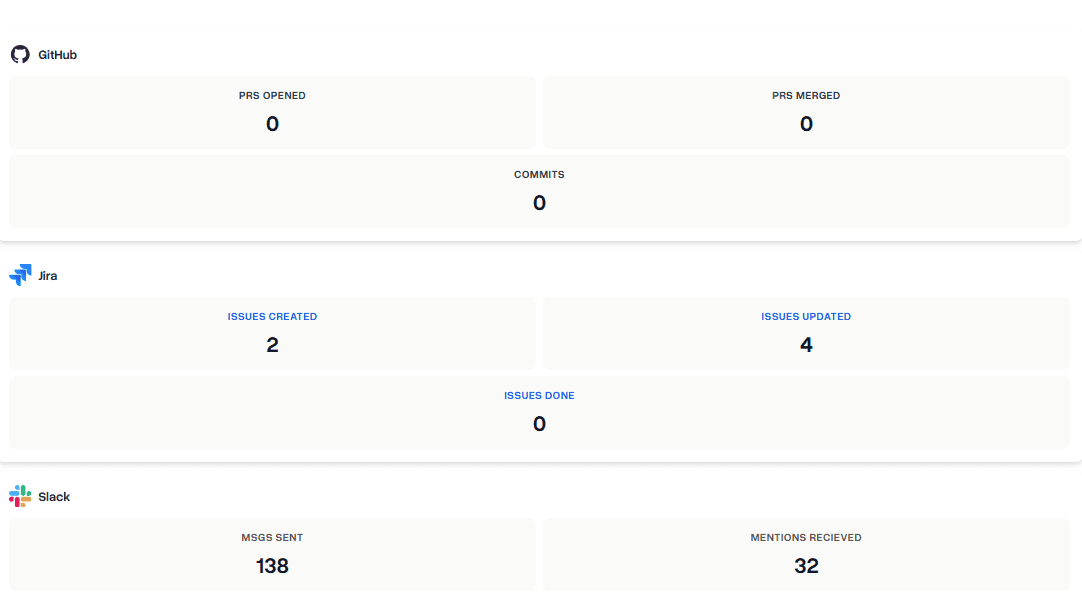
Activity metrics?
Tired of a Dashboard That Doesn’t Lead to Any Obvious Actions?
You're looking at your DORA dashboard. Your Cycle Time is up. Your Deployment Frequency is down. Now what? The problem with raw metrics is that they tell you what happened, but not why. Without context, a metric is just a number—it doesn't help you make better decisions or coach your team effectively.
How it works
We Use Metrics as Inputs to Surface Insights
Aude.ai connects the dots. We surface the underlying context behind DORA metrics. You can see if a High Cycle Time is because of a single, complex PR waiting on review, a cross-team dependency discussion in Slack, or a pattern of rework. This turns a confusing number into a clear conversation starter.
1. Raw Data Inputs

Data from tools you already use.
Slack Conversations
Jira Tickets
GitHub Commits & PRs
Calendar Events
Trello Cards
Confluence Pages
2. Aude Insights Engine

Contextual AI Analysis
3. Actionable Insights

Clear next steps for leaders.
Coaching opportunities
Process bottlenecks
Collaboration patterns
Objective Review Data